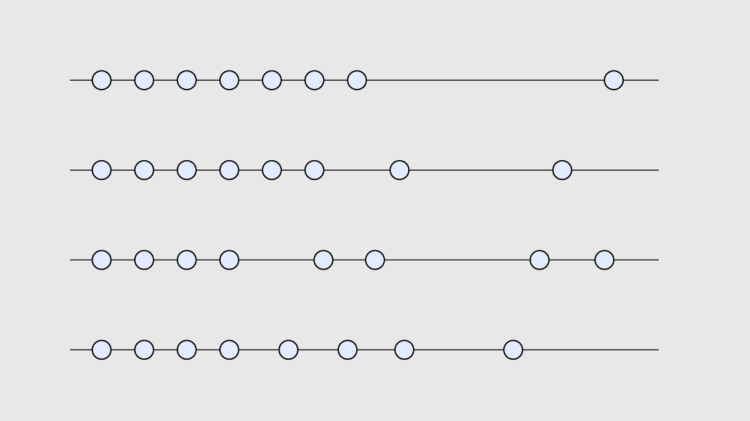
Welcome to The Process, where we look closer at how the charts get made. This is issue #252. I’m Nathan Yau. Visualizing time series data often assumes that your data points are evenly spaced over time, which is not always the case. Here are chart options to show patterns when a time series has uneven gaps.
Become a member for access to this — plus tutorials, courses, and guides.
Source: Data